Hacker Newsnew | past | comments | ask | show | jobs | submitlogin
Launch HN: Pyroscope (YC W21) – Continuous profiling software
102 points by petethepig on Feb 15, 2021 | hide | past | favorite | 29 comments
Hi HN! Dmitry and Ryan here. We're building Pyroscope (https://pyroscope.io/) — an open source continuous profiling platform (https://github.com/pyroscope-io/pyroscope).

We started working on it a few months ago. I did a lot of profiling at my last job and I always thought that profiling tools provide a ton of value in terms of reducing latency and cutting cloud costs, but are very hard to use. With most of them you have to profile your programs locally on your machine. If you can profile in production, you often have to be very lucky to catch the issues happening live, you can't just go back in time with these tools.

So I thought, why not just run some profiler 24/7 in production environment?

I talked about this to my friend Ryan and we started working. One of the big concerns we heard from people early on was that profilers typically slow down your code, sometimes to the point that it's not suitable for production use at all. We solved this issue by using sampling profilers — those work by looking at the stacktrace X number of times per second instead of hooking into method calls and that makes profiling much less taxing on the CPU.

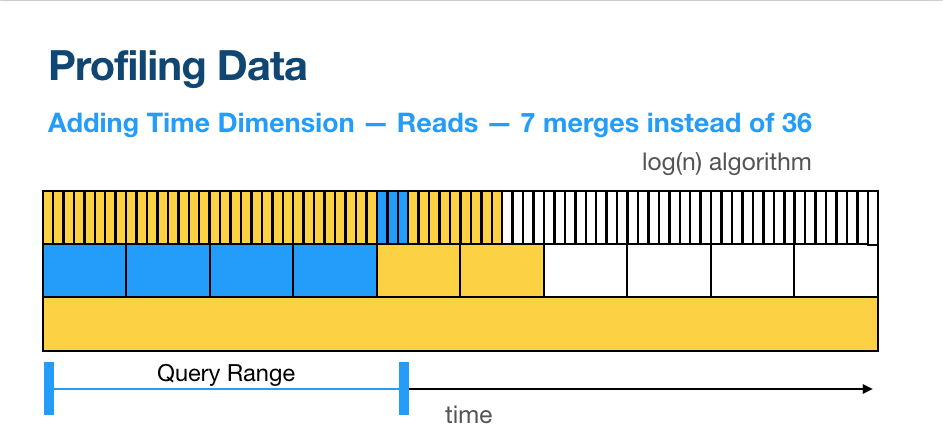
The next big issue that came up was storage — if you simply get a bunch of profiles, gzip them and then store them on disk they will consume a lot of space very quickly, so much that it will become impractical and too expensive to do so. We spent a lot of energy trying to come up with a way of storing the data that would be efficient and fast to query. In the end we came up with a system that uses segment trees [1] for fast reads (basically each read becomes log(n)), and tries [2] for storing the symbols (same trick that's used to encode symbols in Mach-O file format for example). This is at least 10 times more efficient than just gzipping profiles.

After we did all of this we ran some back of the envelope calculations and the results were really good — with this approach you can profile thousands of apps with 100Hz frequency and 10 second granularity for 1 year and it will only cost you about 1% of your existing cloud costs (CPU + RAM + Disk). E.g if you currently run 100 c5.large machines we estimate that you'll need just one more c5.large to store all that profiling data.

Currently we have support for Go, Python and Ruby and the setup is usually just a few lines of code. We plan to release eBPF, Node and Java integrations soon. We also have a live demo with 1 year of profiling data collected from an example Python app https://demo.pyroscope.io/?name=hotrod.python.frontend{}&fro...

And that's where we are right now. Our long term plan is to keep the core of the project open source, and provide the community with paid services like hosting and support. The hosted version is in the works and we aim to do a public release in about a month or so.

Give it a try: https://github.com/pyroscope-io/pyroscope. We look forward to receiving your feedback on our work so far. Even better, we would love to hear about the ways people currently use profilers and how we can make the whole experience less frustrating and ultimately help everyone make their code faster and cut their cloud costs.

[1] https://en.wikipedia.org/wiki/Segment_tree

[2] https://en.wikipedia.org/wiki/Trie


Hi Dmitry, Hi Ryan

I love the fact that this is out! I have been the original author of vmprof and I have been working on profilers for quite some time. I'm also one of the people who worked on PyPy. We never managed to launch a SaaS product out of it, but I'm super happy to answer questions about profiling, just in time compilers and all things like that! Hit me here or in private (email in profile)


Hi Maciej,

vmprof is cool! For Python we currently use py-spy. The way it works is it reads certain areas of process's memory to figure out what the current stack is. It's a clever approach that I like because that means you can attach to any process very quickly without installing any additional packages or anything like that. The downside is that from the OS perspective reading another process's memory is often seen as a threat — so on macOS you have to use sudo, and on Linux sometimes you have to take extra steps to allow this kind of cooperation between processes — we already saw people with custom kernels having issues with it.

Going forward we'll definitely experiment with more profilers and over time add support for other ones as well.

I saw you joined our Slack, we'll be happy to chat about profilers at some point :)


Note that py-spy seems problematic in containers—it requires ptrace, which means you need a special capability, and that's a security risk so many environments won't even give people the option to enable it.

In addition to vmprof, pyinstrument is another alternative.


Fwiw would throw in a feature request for wall-time based profiling / tracing.

A lot of times in micro-services, performance issues are making many/slow I/O calls, and that doesn't really show up on a CPU-based profile.

I.e. "this request took 10 seconds but only 100ms-or-less of CPU time"...


Adding support for this feature might be tricky on some platforms, but I agree, it is important to be able to look at both.


This looks pretty neat! I had a few questions:

- Is there any way to add `perf` profiling?

- Could allocation graphs be added, similar to what pprof offers (e.g. the one midway through this article https://blog.detectify.com/2019/09/05/how-we-tracked-down-a-...)? I've found these to be very helpful in practice since flame graphs make it harder to see what lower-level functions are being called a lot.


RE perf — we're planning to add eBPF support — AFAIK it's a modern equivalent of perf and the output there should be similar to perf.

RE allocations graph, this should be possible, we'll definitely look into integrating it as well.


Gotcha, thanks for the responses. Best of luck!


Nice work! I have maybe a dumb question: why not use a RDBMS to store the logs and use a b-tree index for the range queries? Is there a type of query that you must build your own segment tree index for?


We write profiles to DB with 10 second resolution, so 1 profile with approximately 1000 samples per 10 seconds. When we later read this data, if we're talking about 1 minute of data, we need to merge 6 profiles (1 per 10 seconds). However, if we're talking about an hour of profiling data, that turns into 360 merges. Each merge is expensive, so this whole process becomes somewhat impractical.

That's where segment trees come into play. On each write we "pre-aggregate" data for wider time ranges so that next time there's a wide read we can use a "wider" profile and thus reduce the total number of merges we need to make. Hope this helps visualize it: https://pyroscope-public.s3.amazonaws.com/slides-segment-tre...

Let me know if you have any other questions, happy to answer here or in our Slack.


So you're basically building up a segment tree as more writes come in? Something like this:

      ---AC---
      |       |
      |       | 
    --AB-- --BC--
    |    | |    |
    |    | |    |
    A     B      C
This improves your read speeds, but also increases the amount of data you have to store right? Not saying this tradeoff is bad, just trying to understand the system :).

Also, I see you're using a NoSQL database. How do you store the tries that represent profiles? I'm not familiar with tries, but I assume they have to be serialized in some way to be stored in the database.


Yes, this is pretty close. In our case each new layer has 10 elements and there's no overlaps, so something like this:

      ABCDEFGHIJ          KLMNOPQRST
          +                   +
          |                   |
  +-+-+-+-+++-+-+-+-+ +-+-+-+-+++-+-+-+-+
  | | | | | | | | | | | | | | | | | | | |
  + + + + + + + + + + + + + + + + + + + +
  A B C D E F G H I J K L M N O P Q R S T
And yes, it comes at a cost of increased storage requirements. This is still pretty efficient though as we found out.

Behind the scenes we're using BadgerDB which is a key-value db that handles all the disk operations. All of the data structures we use (segment tries, tries and call trees) are at some point serialized and flushed to disk. For example, here is the trie serialization code https://github.com/pyroscope-io/pyroscope/blob/main/pkg/stor...


Cool! Thanks for explaining :).


Thanks, this perfectly answers my question!


great question.


> using sampling profilers

> at least 10 times more efficient

Ah, it is such an obviously good idea to optimize the basics of profiling and then just generally always log some profiling information that I'm sure this will catch on and become standard practice for all software.

Reminds me of the adage "a little documentation today is better than a lot of documentation tomorrow". Or in your case, a "a little profiling today is better than a lot of profiling tomorrow"


Curious, how does this compare with Datadog's offering?

https://docs.datadoghq.com/tracing/profiler/


The way we see it right now

Pyroscope pros:

* it's open source, you can use it locally, or deploy it in your infra

* our timeline UI is more intuitive imo, e.g you can easily zoom in on particular time ranges you're interested in, you can try it on our demo page: https://demo.pyroscope.io/?name=hotrod.golang.customer%7B%7D...

* it's gonna be cheaper to run in most cases

* we have Ruby support

Pyroscope cons:

* no support for tags right now. There is support for this in the storage engine, but we need to wire the UI and integrations to take advantage of it

* no Java support yet

* no support for memory / IO profiling yet, just CPU


I bumped onto pyroscope earlier this month and loved how easy it is to get up and running and integrating with golang services. I'm looking forward to see how pyroscope evolves! All the best luck :D


Hi there,

I'm very happy you found it easy to install. This has definitely been one of our priorities from the beginning — I personally feel like it's a very important, but often overlooked detail, particularly in open source projects.


This is really lovely. I'm looking forward to seeing more developments! :-)


This looks great. I think it would help to detect performance issues in running applications.

By the ways is there some solution to profile memory? So basically find out which part of the code is accumulating memory (that may happen very very slow). That is often, at least in my perspective, much much harder than profile cpu usage.


For memory that are actually two different domains, with different problems, different UX requirements, and different solutions:

1. For server workloads, the main issue is usually leaks. Lacking leaks you can just characterize the workload, give it enough memory (usually it's not very much per request), and call it a day.

2. For batch data processing, the main issue is ... using lots of memory to process the data :) Like, loading 4GB of data and doing stuff to it can easily use 20GB of RAM if you're not careful.

For the latter case, and specifically for Python, I've written an open source memory profiler (https://pythonspeed.com/fil) that helps you spot which code allocated the memory responsible for peak memory. You can also use it for leaks, but that's not the main use case.

It has some performance overhead, so it's not usable in production, but I'm also working on version that will be fast enough to run in production, at the cost of slightly less accuracy. For batch processing workloads that loss of accuracy isn't meaningful, mostly, who cares if you're off by 1MB on a 20GB peak memory usage. For server workloads with memory leaks... might take a lot longer to catch the problem as a result of reduced accuracy, and a tool designed specifically for server workloads might work better by taking a different implementation approach.


Yes, this kind of data would definitely be great to have as well and we're planning to add that at some point. I think in Go there's at least a clear path to that, afaik pprof already has something for memory profiling, but with other languages it might be more complicated.


I see the current arch uses a separate process.

Is the JVM integration likely to follow the same path or use a Java Agent?

Very cool project, continuous profiling, distributed tracing and always-on debugging are production tooling I feel will eventually become common place just need to crack through the YAGNI by making them easier to obtain.


I think for languages like Java we're gonna have the profiler run inside the profiled process. This is how it currently works in our Go integration.

RE continuous profiling and things: that's our hope as well. At my last job I got a lot of people to start using these kinds of tools and it's fun to watch this technology adoption process that goes from "why do I need this?" to "I remember you showed me this once, how do I use it again?" to "wow, this saved us so much time / money".

It's a bit of an uphill battle, but we're hopeful because there's clearly value in these tools.


That is good news. I think Java Agent is definitely the way to go for JVM. Gives you all the access and APIs you need with low resource usage and only need to drop file in place add flag to JVM.

If you don't need the C API you can also write the agent in a JVM language which obviates the need platform specific binaries.

Agree wholeheartedly on direction, I'm hoping for a final phase of "of course we have that" but maybe that is wishful thinking considering not even good metrics are a given in many shops still but we can hope for a better future.


What's the best way to think of this as compared to a service like New Relic, Skylight, or Datadog? Same thing but open source, or is it offering something unique? Great to see new entrants in the space.


This is so neat ! Congratulations and all the best !


Guidelines | FAQ | Lists | API | Security | Legal | Apply to YC | Contact

Search: