How on earth was this your takeaway from the article? The impact of social political views wasn't mentioned once, and Dr. Corak clearly explains the actual reasons.
Even a glance at the map disproves your point. BC outside of Vancouver and Victoria is relatively socially conservative, but it's a sea of red due to the lack of labour demand in those rural areas.
> How on earth was this your takeaway from the article?
Perhaps he looked at a map[1]? I have to admit, while there are some clear deviations, as I flip between the two images the areas with the highest mobility do seem to follow the Conservative-leaning areas. It is definitely not a perfect 1:1 mapping, but interesting nevertheless.
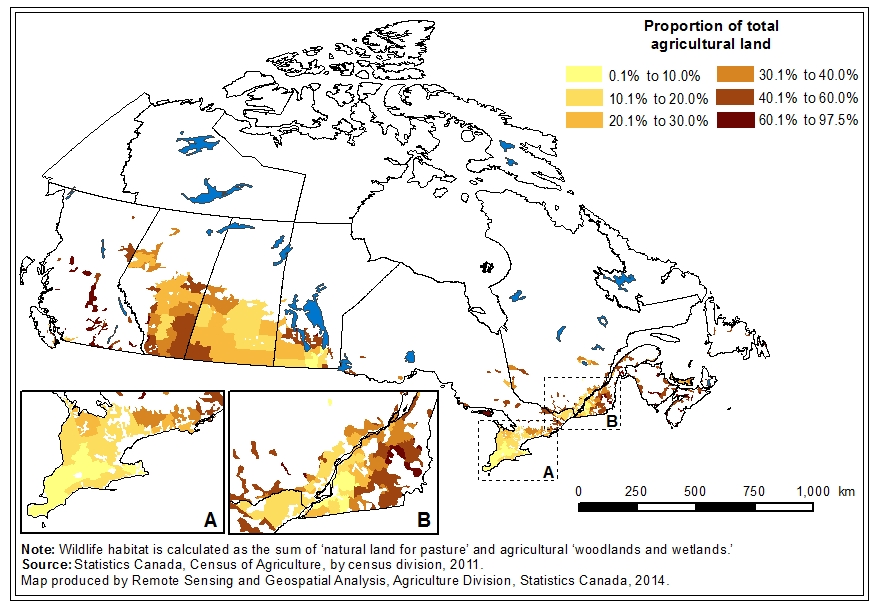
What really stands out to me though is that the areas with arable land[2] (and oil) generally have the most mobility. Makes me wonder if the food and energy commodities boom from a few years back has skewed the numbers?
The issue is that the map doesn't account for population density. Toronto has high population density but it shows up as a very small dot compared to large country-side-right-leaning regions that will take half the territory of a province.
I'm not sure population density matters here. The GTA clearly shows up as red on the political map and green on the mobility map. As mentioned, there are plenty of places where it does not hold true. In fact, some of the largest ridings of all (Northern Quebec, Yukon, NWT) are not Conservative leaning, yet are on the green side for mobility. But there still does seem to be a trend towards the mobile regions leaning to the right.
The point is that that "dot" of Toronto GTA represents more human beings than all of Alberta.
You're judging by "geographic space taken up". Your conclusion is actually that geographic land area leans to the right, or more prosaically, that liberals move to cities and that coincidentally, oil was found in a right-leaning province.
The original assertion referred to neighbourhoods, which do tend to grow inversely to the population density. In my experience, a resident of Toronto might consider their neighbourhood to be just a block or two. While rural residents think of their neighbourhood as a many kilometre wide radius. Census/electoral divisions are a decent proxy for what we are trying to measure here, I feel. Certainly for the medium-sized rural divisions that are most relevant to the discussion.
I believe I understand what you and the parent are getting at, but it appears to be of a different discussion.
Not to mention the Sudbury and Waterloo area which is super left-wing and unionist. I mean, anecdotal, but I feel like it's okay to counter an anecdote with an anecdote in this case? Further analysis would require access to the data being shown here and cross referencing it with the outcome of past elections.
Even a glance at the map disproves your point. BC outside of Vancouver and Victoria is relatively socially conservative, but it's a sea of red due to the lack of labour demand in those rural areas.